8. Troubleshooting
Last update: June 27, 2022 16:22 UTC (1a7aee0a0)
If you have set up your software, you usually want to know whether it works. This section discusses topics related to configuration, monitoring, troubleshooting, and debugging of NTP.
8.1 Monitoring
8.1.1 How do I confirm my NTP server is working fine?
8.1.2 How do I use peerstats and loopstats?
8.1.3 How can I see the Time Difference between Client and Server?
8.1.4 What does 257 mean as value for reach?
8.1.5 How do I use statistics files?
8.1 Monitoring
Without any doubt, troubleshooting requires monitoring. Somehow you must find out that something is wrong before you wonder how to fix it.
8.1.1 How do I confirm my NTP server is working fine?
One of the quickest commands to verify that ntpd is still up and running is ntpq -p. That command will show all configured peers together with their performance data.
As the above command requires periodic invocation to monitor performance, it is also recommended to enable statistic files in ntpd.
8.1.2 How do I use peerstats and loopstats?
I use the following lines in /etc/ntp.conf to enable loopfilter statistics. New files are created every day, and the current files are available as /var/log/ntp/peers and /var/log/ntp/loops. Older files are archived as /var/log/ntp/peersYYYYMMDD and /var/log/ntp/loops.YYYYMMDD:
statistics loopstats
statsdir /var/log/ntp/
filegen peerstats file peers type day link enable
filegen loopstats file loops type day link enable
Usually I only monitor the loops file. Table 8.1a lists the individual fields of each file.
Table 8.1a: Statistic Files
| File Type |
List of Fields |
loopstats |
day, second, offset, drift compensation, estimated error, stability, polling interval |
peerstats |
day, second, address, status, offset, delay, dispersion, skew (variance) |
8.1.3 How can I see the Time Difference between Client and Server?
(By Terje Mathisen) Normally ntpd maintains an estimate of the time offset. To inspect these offsets, you can use the following commands:
ntpq -p will display the offsets for each reachable server in milliseconds (ntpdc -p uses seconds instead).ntpdc -c loopinfo will display the combined offset in seconds, as seen at the last poll. If supported, ntpdc -c kerninfo will display the current remaining correction, just as ntptime does.
The first command can be used to check what ntpd thinks the offset and jitter is currently, relative to the preferred/current server. The second command can tell you something about the estimated offset/error all the way to the stratum 1 source. Q: 8.1.2 describes a way to collect such data automatically.
If a PPS source is active, the offset displayed with the second choice is updated periodically, maybe every second.
Sometimes things are wrong and you may want to compare time offsets directly. An easy way is to use ntpdate -d server to compare the local system time with the time taken from server.
8.1.4 What does 257 mean as value for reach?
(Inspired by Martin Burnicki) The value displayed in column reach is octal, and it represents the reachability register. One digit in the range of 0 to 7 represents three bits. The initial value of that register is 0, and after every poll that register is shifted left by one position. If the corresponding time source sent a valid response, the rightmost bit is set.
During a normal startup the registers values are these: 0, 1, 3, 7, 17, 37, 77, 177, 377
Thus 257 in the dual system is 10101111, saying that two valid responses were not received during the last eight polls. However, the last four polls worked fine.
8.1.5 How do I use statistics files?
You can do a lot of useful things with statistic files before you remove them. For example there is a utility named summary.pl written in Perl to compute mean values and standard deviation (RMS) from the loopfilter and peer statistics. It will also show exceptional conditions found in these files. Here’s a short example output of summary.pl --dir=/var/log/ntp --start=19990518 --end=19990604:
loops.19990518
loop 110, -30+/-36.5, rms 6.7, freq 14.95+/-1.149, var 0.612
loops.19990519
loop 113, -26+/-40.3, rms 6.9, freq 12.95+/-3.240, var 1.378
loops.19990520
loop 107, -7+/-32.0, rms 5.7, freq 13.04+/-3.253, var 1.579
loops.19990522
loop 190, 3+/-18.5, rms 2.9, freq 15.48+/-3.715, var 0.604
loops.19990523
loop 146, -5+/-9.2, rms 1.9, freq 15.77+/-0.716, var 0.305
loops.19990604
loop 73, -27+/-29.8, rms 6.9, freq 16.81+/-0.327, var 0.140
Still another utility named plot_summary.pl can be used to make plots with these summary data. As an alternative you could plot the loopfilter file directly with gnuplot using the command plot "/var/log/ntp/loops" using 2:3 with linespoints.
The “GNU” in gnuplot is NOT related to the Free Software Foundation, the naming is just a coincidence (and a long story). Thus gnuplot is not covered by the Gnu copyleft, but rather by its own copyright statement, included in all source code files.
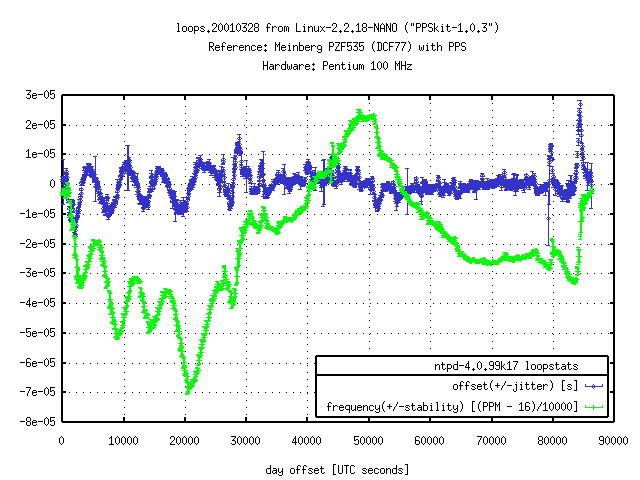
Figure 8.1a was produced with a little more complicated command. It shows yerrorbars with the estimated errors for offset and frequency respectively.
Figure 8.1a: Plot of estimated Offset and Frequency Error (DCF77)

The reference clock, the antenna, and the computer system were located in an office room without air conditioning.
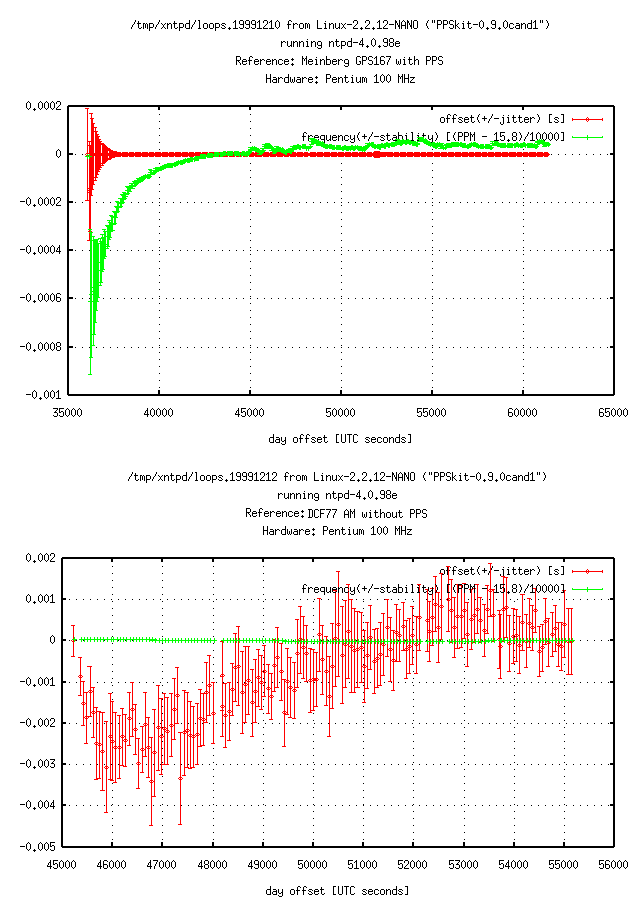
Now that we are looking at numbers and graphs, let us compare the data of a GPS clock (using PPS) with a typical low-cost clock (not using PPS). Figure 8.1b shows a very small offset for the GPS clock. The frequency is continuously adjusted. In comparison, the DCF77 clock shows a high variation for the offset, but the frequency is adjusted less drastically. Figure 8.1a shows values between those, using a better DCF77 receiver with PPS.
Figure 8.1b: Comparing Offset and Frequency Error of DCF77 and GPS
